![]()
Using spreadsheet to estimate the future cost of U.S. stamps
(I worked on this writeup during this Thanksgiving and finished it 12th on the computer on Nov.30,2009)
Chen Tian
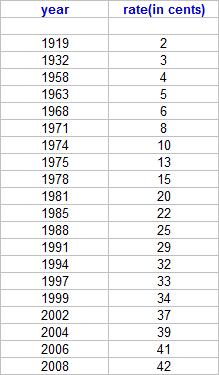
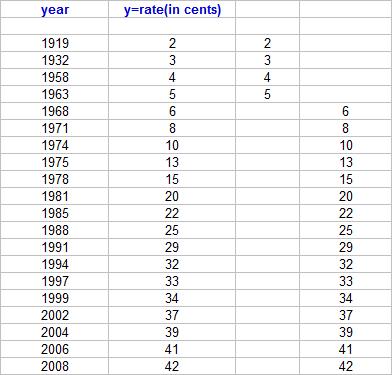
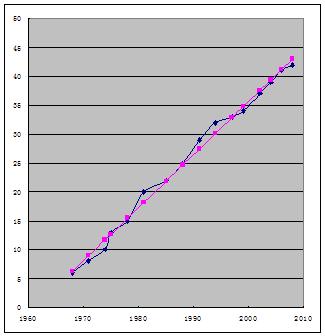
This following data set is based on the first class letter postage for the US Mail from 1933 to 2008. Plot the data and develop a prediction function. When will the cost of a first class postage stamp reach $1.00? when will the cost be 64 cents? how soon should we expect the next 3 cent increase?
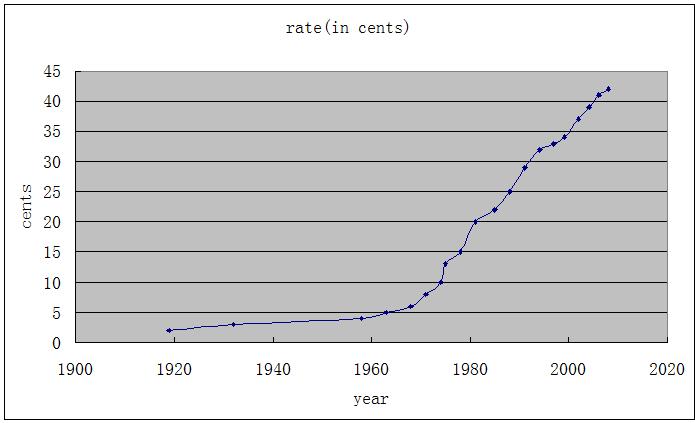
From the first looking at the curve shown above it definitely is not linear, but more looks like the graph for an exponential function. So let’s give it a try as shown in the following table and graphs.
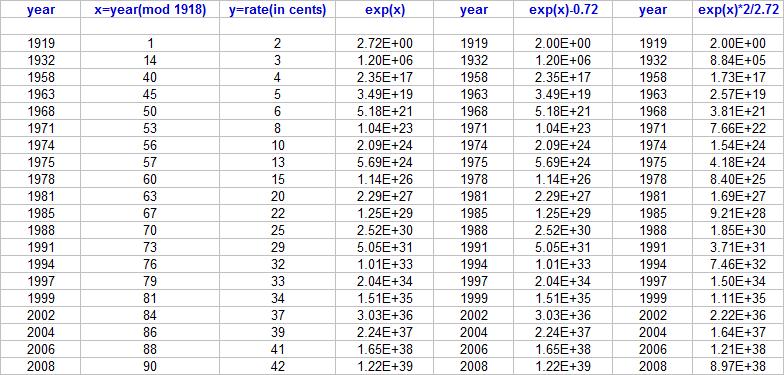
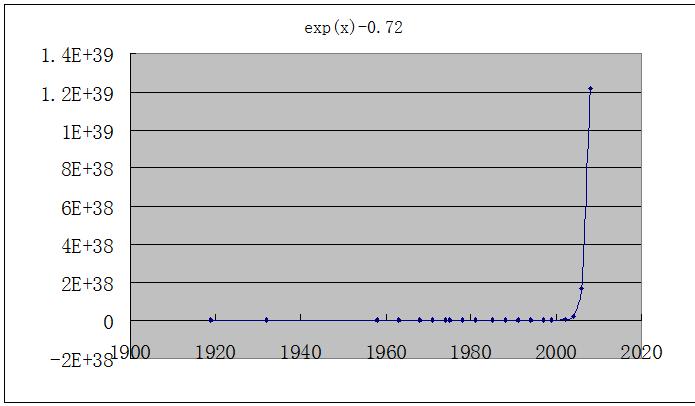
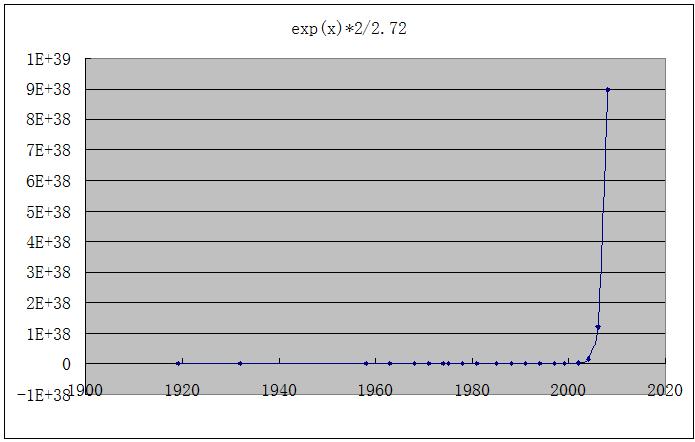
We see that the y value increases very quickly, and none of the trials fits the original data. Actually we may intuitively think that exponential function is not a good choice since the rate of the stamp can not increase as fast as an exponential function does.
However, look at the curve again. We may notice that the graph between Year 1919 and Year 1963 and the graph between Year 1968 and Year 2008 looks, separately, linear. So we want to get the linear estimation function for the rates of stamps after Year 1968.
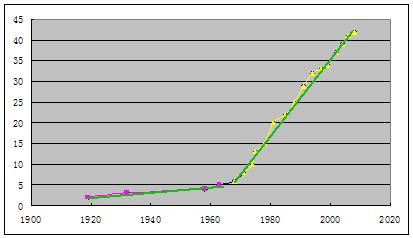
We calculate the average year (mod 1918), which is 70.8125, and then the average rates of the stamps, which is 25.375. We take (70.8125, 25.375) as a point on the estimation line (a “ray” actually).
We draw a segment which seems to fit the original data best, and then the points (50, 6) and (88, 41) look like coinciding with the estimation points. So we use these two points to get the slope of the line, which is 0.921052632.
Thus, we get the estimation line in point-slope form, which is

Then we plug the x values to get the estimation y values, which look good, no big errors.
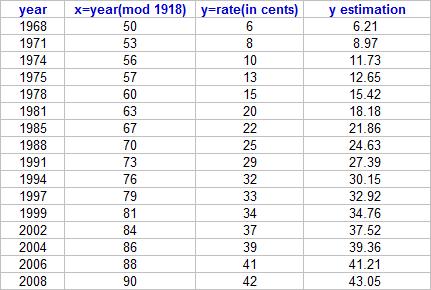
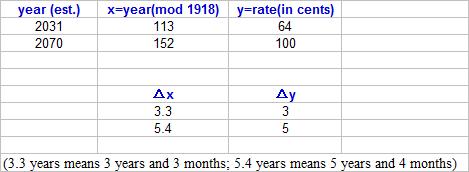
Now we may use the estimation function when the year is greater than 1968 to estimate when the cost of a first class postage stamp will reach $1.00? And when 64 cents? How soon should we expect the next 3 or 5 cent increase?
We change the function into the form
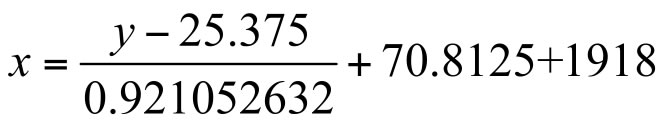
Then when we input a y value, we will get a corresponding x value, which we round to integer, i.e., the estimating year when the rate of stamp is given.
The slope let us be able to get the increasing function:
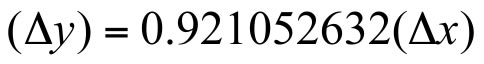 or
or 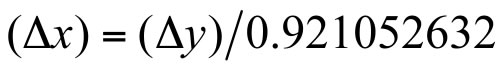 .
.
Then when a difference of cost of stamps ![]() is given we will be able to estimate the span of time in years
is given we will be able to estimate the span of time in years ![]() .
.
Here is our estimation:
Extension for students: try to find out certain polynomial function with proper domain fits the data as well. They may start with the quadratic function 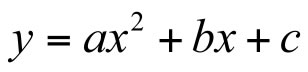 with real coefficients, and plug in three points to solve the system of three linear equations with three unknowns. It will be a concave quadratic function. After the cost of the stamp reaches its peek/inflection point, it will go down somehow. So quadratic function estimation might be a good try. Or some students may argue logrithmic function is also a good and possible estimation.
Of course, certain professional software will get a much more precise estimation, but going through most of the mathematical ideas involved in this problem (for example, these typical functions above) is more important to students than getting the correct answers without using their brains.
Return to my homepage for EMAT 6680